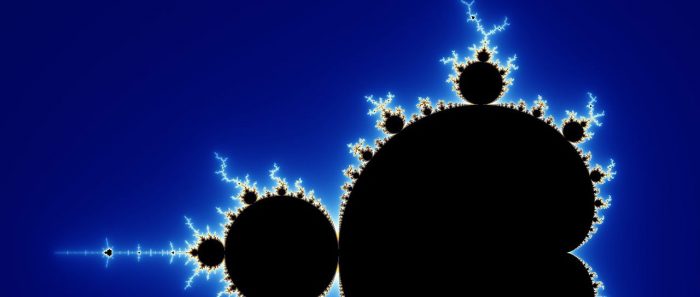
Fractals are one of those concepts that are hard to explain in words, but incredibly powerful when visualised. Here’s a few examples.
1. The Mandelbrot set
Probably the most famous fractal, the Mandelbrot set is a visualisation of the results of an iterative function where the coordinates are shaded depending on the function’s output at that point. It sounds complicated, but here’s a fun explainer and just look at this:
2. The Sierpinski triangle
The Sierpinski triangle is perhaps not as visually impressive as the Mandelbrot set, but the mathematics behind it are beautiful in their own way.
The amazing thing about the Sierpinski triangle is that the pattern can emerge from a seemingly random process called the Chaos Game.
Draw a triangle. Choose a point at random within the triangle and draw a dot there. Use a dice to randomly choose a corner, then draw a dot halfway between the dot you just drew and that corner. If you repeat it enough times, you’ll see the Sierpinski triangle emerge.
Here’s a video of a Chaos Game. As you watch you’ll see the pattern building as if by magic. Incredible, right?
3. The Dragon Curve
The Dragon Curve is a fractal created by repeatedly overlaying rotating copies of a pattern on itself.
The cool thing about the Dragon Curve is that you can draw it yourself with some graph paper, some tracing paper and a little patience. It starts simple but quickly gets very complex.
The Dragon Curve is also known as the Jurassic Park Curve because iterations of it were used to illustrate the chapter title pages in the original book.
This article was written as part of my November writing challenge, a NaNoWriMo-inspired attempt to write one short, snappy article a day in November. Please excuse brevity, but let me know if I’ve missed anything important!
